Skip to content

SAS Example Code

Examples, Tips & Tricks

  • How To’s
  • Functions
  • Statements
  • Formats
  • Macros
  • Data Visualisation
  • About

Tag: Scatter Plot

Create One Page with Multiple Charts in SAS
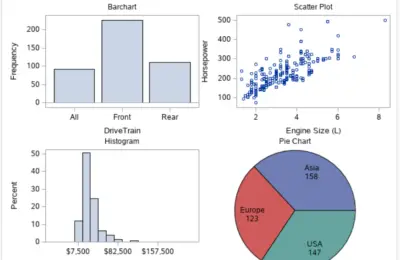
SAS How To's

Create One Page with Multiple Charts in SAS

In this article, we demonstrate how to create one image with multiple charts or graphs in SAS. The example contains…
11/10/202016/09/2020 SAS Example Code
Learn How To Create Attractive Scatter Plots in SAS
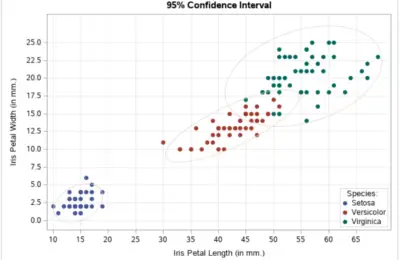
SAS How To's

Learn How To Create Attractive Scatter Plots in SAS

In this article, we explain how to create a Scatter Plot in SAS.
27/09/202025/09/2021 SAS Example Code

Search

  • How To’s
  • Functions
  • Statements
  • Formats
  • Macros
  • Data Visualisation
  • About
  • Privacy Policy
  • Advertise
WordPress Theme: BlogGrid by TwoPoints.