This is the third article in our series on graphs and charts in SAS. In this article, we explain how to create one page with multiple charts in SAS. At the end of this article, you will be able to create one image with four different graphs and/or charts.

Contents
How to Create One Image with Multiple Charts and Graphs?
By default, SAS creates a different object each time you generate a chart, graph, or plot. However, in some situations, it is necessary to create just one image/page with multiple charts. Although this might seem difficult, it’s fairly easy.
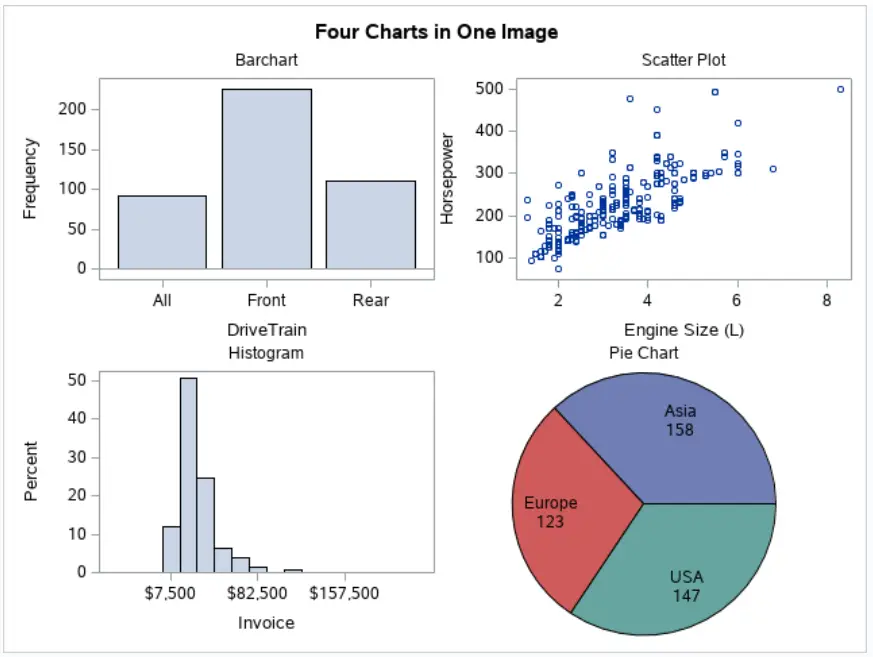
With the example code below, we generate one image with a 2-by-2 grid. We fill the grid with a bar chart, a scatter plot, a histogram, and a pie chart using the Cars data set in the SASHELP library.
proc template;
	define statgraph multiple_charts;
		begingraph;
			entrytitle "Four Charts in One Image";

			/* Define Chart Grid */
			layout lattice / rows = 2 columns = 2;

				/* Chart 1 */
				layout overlay;
					entry "Barchart" / location=outside;
					barchart category=DriveTrain;
				endlayout;

				/* Chart 2 */
				layout overlay;
					entry "Scatter Plot" / location=outside;
					scatterplot x=EngineSize y=Horsepower;
				endlayout;

				/* Chart 3 */
				layout overlay;
					entry "Histogram" / location=outside;
					histogram Invoice;
				endlayout;

				/* Chart 4 */
				layout region;
					entry "Pie Chart" / location=outside;
					piechart category=Origin;
				endlayout;
			endlayout;
		endgraph;
	end;
run;

proc sgrender data=sashelp.cars template=multiple_charts;
run;
Create a Grid
The trick to create one page with multiple charts in SAS is to create a grid. You can create the grid with the layout lattice statement.
layout lattice / rows = 2 columns = 2;
code for graphs;
endlayout;
With the statement above, you create a 2-by-2 grid/lattice. Needless to say, you can change the dimensions of the grid with the rows and columns parameters.
Create Graphs and Charts
Once you have defined the grid, you need to fill it with graphs, charts, and/or plots, for example, a scatter plot. Depending on what you want to show you need to use the layout region statement or the layout overlay statement. Within these layouts, you create your graphs as you are used to.
Adding a Separate Title for each Chart
Normally, you use the entrytitle statement to add a title to your charts. However, in the image above, we have four different charts. To add a separate title for each chart, you need the entry statement. You can use the location option to specify where to place the title. For the general title, you can still use the entrytitle statement.
This article just covered the basics of how to create in SAS one simple page with multiple charts. However, there exists a wide variety of options you can use the enhance your image even more.


One thought on “Create One Page with Multiple Charts in SAS”
Comments are closed.