Skip to content

SAS Example Code

Examples, Tips & Tricks

  • How To’s
  • Functions
  • Statements
  • Formats
  • Macros
  • Data Visualisation
  • About

Data Visualisation in SAS

On this page, you find an overview of all articles on this site regarding Data Visualisation in SAS (graphs, charts, plots, etc.)

  • How to Create a Bar Chart
  • How to Create a Boxplot
  • How to Create a Histogram
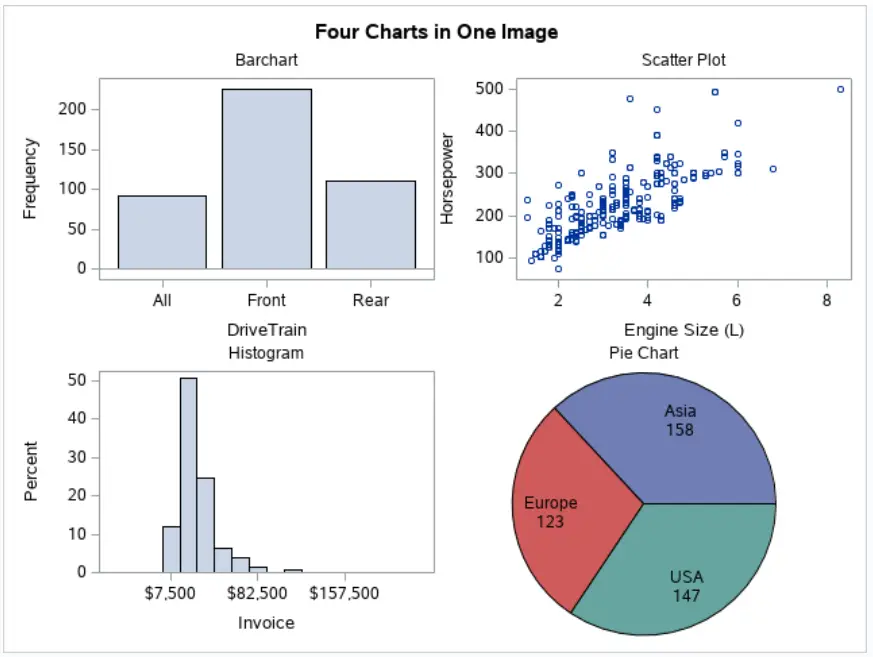
  • How to Create One Page with Multiple Charts
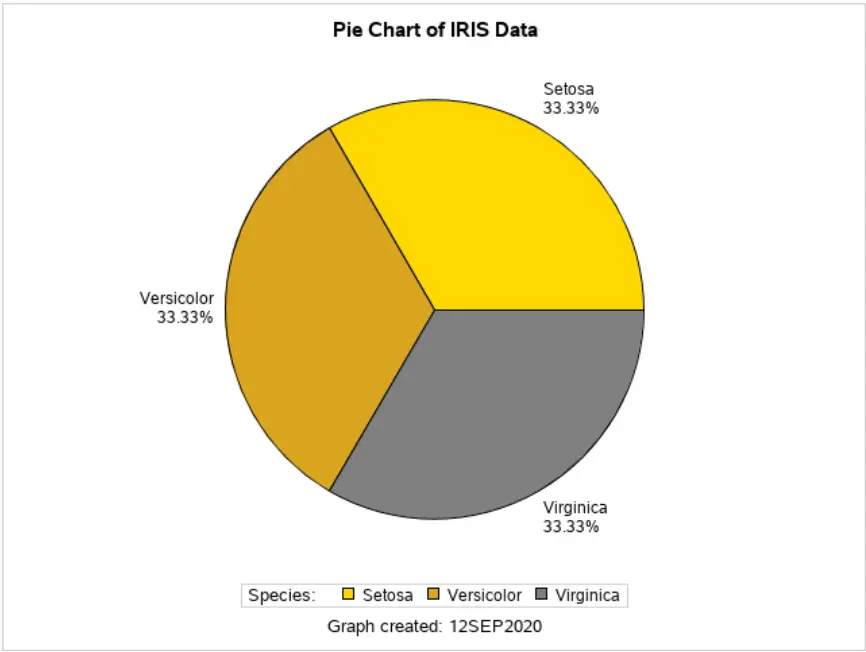
  • How to Create a Pie Chart
  • How to Create a Scatter Plot (Easy)
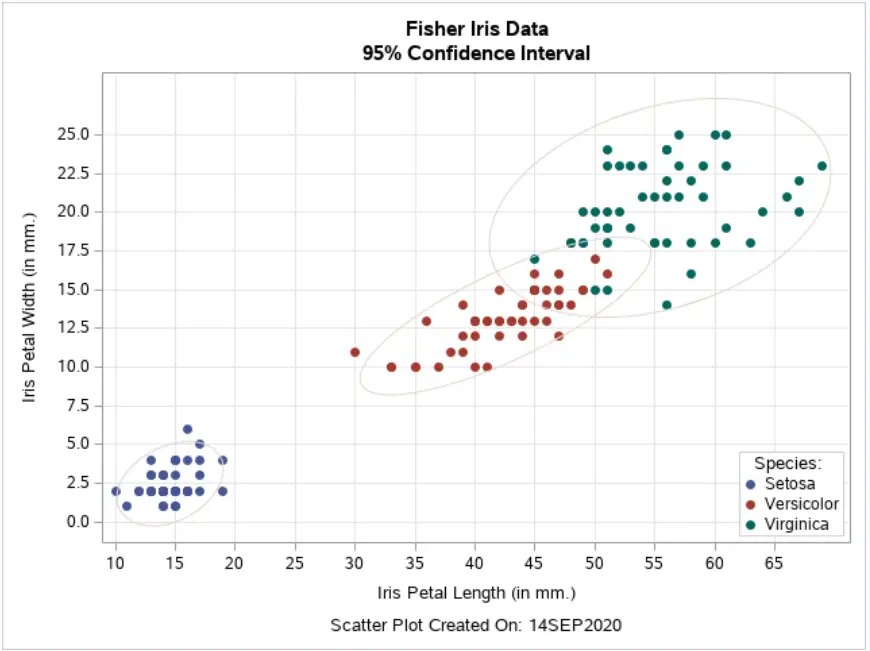
  • How to Create a Scatter Plot (Advanced)
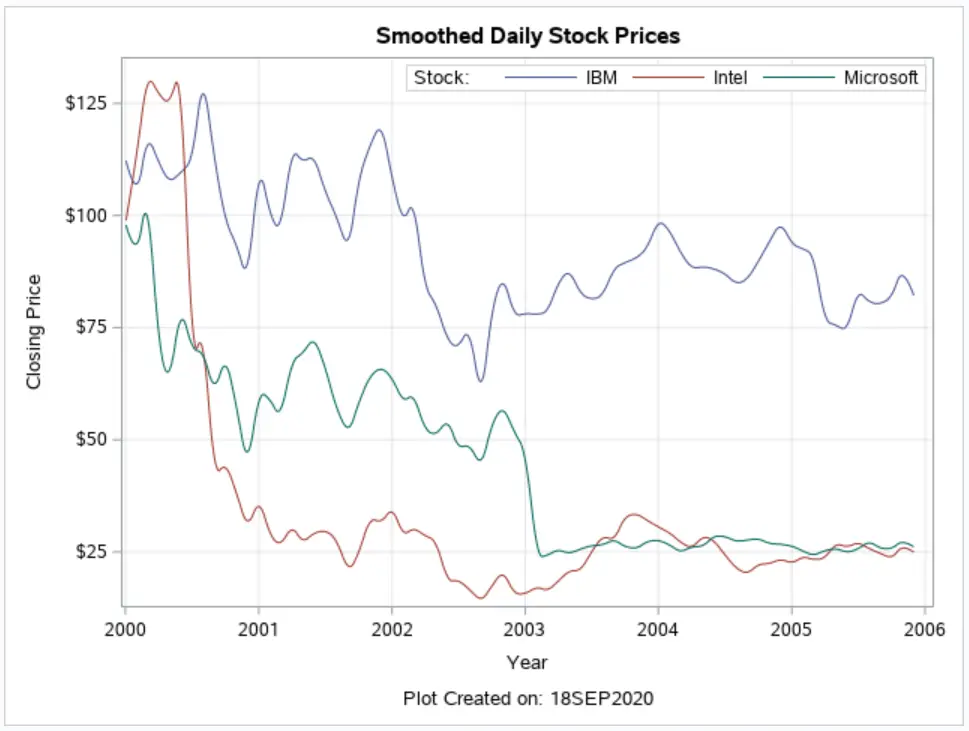
  • How to Create a Time Series Plot

Search

Popular Posts

  • How to Use the INTNX Function in SAS [Examples]
  • How to Rank Data in SAS with PROC RANK [Examples]
  • How to Easily Create an XML File in SAS
  • How to Perform a Student’s T-Test in SAS [Examples]
  • How to Format Variables in PROC MEANS, FREQ, and TABULATE in SAS

Search

  • How To’s
  • Functions
  • Statements
  • Formats
  • Macros
  • Data Visualisation
  • About
  • Privacy Policy
  • Advertise
WordPress Theme: BlogGrid by TwoPoints.