As a data analyst, you can summarize your data in many ways, for example, the average per group.
In SAS, the 5 most common ways to calculate the average per group are PROC SQL, PROC MEANS, PROC TABULATE, PROC REPORT, and a Data Step. We provide examples and SAS code to compare these 5 methods based on complexity, type of output (report and/or dataset), and flexibility considering formatting, sorting, and labeling.
For each method, we explain how to interpret the SAS code, show the output, and discuss the advantages and disadvantages.
Do you know? How to Count the Number of Observations per Group
Contents
Sample Data
In the examples in this article, we use the sample dataset below. It contains 10 observations of students and the exam results. All students took between 1 and 3 exams. We want to calculate the average result per student.
The name of the table is work.exam_results.

data work.exam_results;
	input student $ exam $ result;
	datalines;
Jack Physics 90
Jack Biology 80
Jack Geometry 92
Will Geometry 70
Will Biology 72
Maria Physics 85
Emma Biology 90
Emma Physics 75
Jim Biology 65
Jim Physics 73
;
run;

proc print data=exam_results noobs;
run;
Method 1: PROC SQL
The first method to calculate the average per group is with PROC SQL.
PROC SQL is a powerful procedure that you can use to write SQL code in SAS. So, if you are familiar with SQL, this method is probably the best for you to calculate the average per group.
The Code
Let’s see how the SQL is structured:
proc sql;
	create table work.avg_by_group_1 as
		select student,
			avg(result) as avg_result format=comma12.2
		from work.exam_results
		group by student
		order by calculated avg_result desc;
quit;

title "Avg. by Group (PROC SQL)";
proc print data=work.avg_by_group_1 noobs;
run;
title;
- CREATE TABLE work.avg_by_group_1 AS
With the CREATE TABLE statement, we specify that we are creating a new table. The statement is followed by the name of the new table (work.avg_by_group_1) and the keyword AS.
You can omit this statement if you only want to show the average per group on the screen without creating a new table. - SELECT student
With the SELECT statement, we define the columns of our new table. Because we want to calculate the average result per student, we select the student column.
- avg(result) as avg_result
The function avg(<argument>) calculates the average of its argument. Since we want to calculate the average result, the argument is the result column.
After the AS keyword, we define the name of the column that contains the average result.
Optionally, you can format the new column. In the example, we use the comma format. - FROM work.exam_results
We use the FROM statement to specify which table to use for the calculations.
- GROUP BY student
With the GROUP BY statement, we specify how to group the data to calculate the average. We want to calculate the average per student, so we use GROUP BY student.
If you want to group your data based on more columns, you separate the column names with a comma. - ORDER BY calculated avg_result desc
Finally, we use the ORDER BY statement to order the average examen result in descending order. This statement is optional.
The Result
The image below shows the new table created by the code above. The table is ordered by the average result and the numbers are formatted with two decimals.
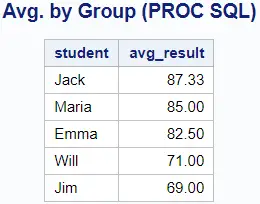
In contrast to other methods, PROC SQL creates either a new table or a report. If you want to create both, it’s necessary to run the code twice, omitting the CREATE TABLE statement in one of the runs.
Instead of the AVG() function, you can use the MEAN() function. Both functions return the same result (ignoring missing values).
Advantages & Disadvantages of PROC SQL
So, to conclude, when should you use PROC SQL to calculate the average per group?
Method 2: PROC MEANS
The second method to calculate the mean per group is with the PROC MEANS procedure.
PROC MEANS is a common and powerful SAS procedure to quickly analyze numerical data. By default, it shows you the number of observations, the mean, the standard deviation, the minimum, and the maximum for each numeric column. Besides, PROC MEANS can also calculate the sum, the percentiles, ranges, etc.
The code
To create a simple report with PROC MEANS you only need to provide the name of the input dataset.
proc means data=work.exam_results;
run;
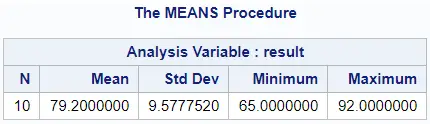
The image below shows the default output of PROC MEANS.
However, because we want to calculate the average per group, we need to modify the code above a bit.
First of all, we need the CLASS statement to define the group. As we calculate the average exam result per student, we need to add CLASS student.
Secondly, although not necessarily in this example, we add VAR result. With this statement, we specify the variable we want to analyze. If you don’t add the VAR statement, SAS will show a report for each numerical variable separately. However, because we only have one numerical variable, we could omit this statement in our example.
proc means data=work.exam_results nway;
	class student;
	var result;
run;
By default, PROC MEANS doesn’t create an output dataset. Instead, it generates only a report.
However, you can add the OUTPUT statement to create an output table. The OUTPUT statement is followed by out= and the name of the new table.
Additionally, you can specify the statistic or statistics that should be included in the output dataset. If you don’t specify which statistic(s) you want, SAS will select all 5 default statistics.
If you specify the statistic that should be included, then it’s obligatory to define the name of the column that it will have in the output dataset. For example, avg_result.
proc means data=work.exam_results nway;
	class student;
	var result;
	output out=work.avg_by_group_2 mean=avg_result;
run;
The Result
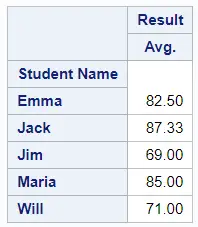
If you run the code above, PROC MEANS create a report and a dataset.
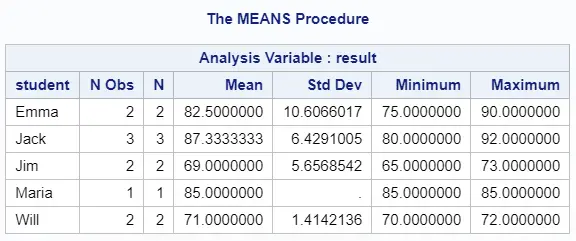
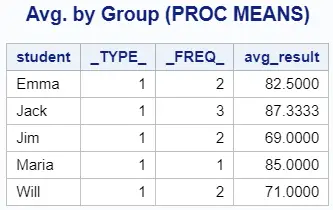
The report and the output dataset that PROC MEANS generates are different. The report contains several descriptive statistics by default, while the output dataset has only the specified statistic. The output dataset also contains two extra columns: _TYPE_ and _FREQ_.
If you use PROC MEANS you can’t order, neither format the results. You will need PROC SORT to order your data, and a Data Step to format it.
Advantages & Disadvantages of PROC MEANS
So, what are the advantages and disadvantages of PROC MEANS to calculate the average per group?
Method 3: PROC TABULATE
The third method to calculate the average per group is with PROC TABULATE.
PROC TABULATE is a procedure used to display descriptive statistics in tabular form. So, this procedure is mostly used for reporting purposes. However, you can use the procedure also to create an output dataset with the average per group.
The code
Let’s investigate the code that calculates the average per group with PROC TABULATE.
proc tabulate data=work.exam_results out=work.avg_by_group_3;
	class student;
	var result;
	table student = "Student Name",
		result = "Result" *(mean = "Avg." * format=comma12.2);
run;

title "Avg. by Group (PROC TABULATE)";
proc print data=work.avg_by_group_3 noobs;
run;
title;
First of all, the syntax of PROC TABULATE is more complex than, for example, PROC SQL or PROC MEANS. But, because of its complexity, it gives you more flexibility to create beautiful reports.
Secondly, you need the CLASS and VAR statements to calculate the average per group. With the CLASS statement, you define the variable by which you group your data. While with the VAR statement, you specify the variable that you want to analyze.
Finally, you use the TABLE statement to calculate the average per group. This statement can be quite complicated because you use it to carry out the calculation, format the data, and give labels to the data.
If you only want to calculate the average exam result per student without any formatting, then this code satisfies your needs:
TABLE student, result*(mean)
By default, PROC TABULATE doesn’t generate an output dataset. You need to add the OUT= statement to create one.
The Result
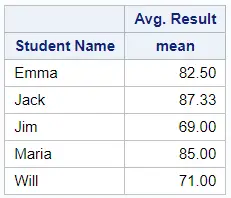
If you run the code above, PROC TABULATE will generate a report and create an output dataset.
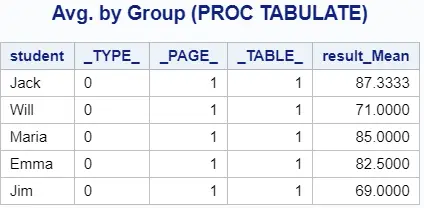
The formatting options, for example, for the number of decimals and header labels, only affect the report. With PROC TABULATE, you can neither format data values nor define the column names in the output dataset. Besides, the output dataset contains three extra columns.
Advantages & Disadvantages of PROC TABULATE
So, when should you use PROC TABULATE?
Method 4: PROC REPORT
The fourth method to calculate the average per group in SAS is with PROC REPORT.
PROC REPORT is a powerful SAS procedure to summarize and display data. The procedure is flexible and highly customizable. Although it’s normally used to present data, it can also be used to create an output dataset with the average per group.
The Code
Let’s investigate the code of PROC REPORT to calculate the average exam result per student.
proc report data=work.exam_results out=work.avg_by_group_4;
	column student result, (mean);
	define student / group "Student Name";
	define result / analysis "Avg. Result" format=comma12.2;
run;

title "Avg. by Group (PROC REPORT)";
proc print data=work.avg_by_group_4 noobs;
run;
title;
If you execute PROC REPORT with just the DATA= statement, then SAS shows the input data on your screen. So, in this case, PROC REPORT and PROC PRINT give the same result.
To calculate the average per group with PROC REPORT, you need to add the following statements.
With the COLUMN statement, you specify the columns of the report. For our purpose, we use the student column and the result column. Since we want the average exam result per student, we use result, (mean).
With the DEFINE statements, we can define each column. That is to say, its function, its format, and its label.
To group the exam result per student we use DEFINE student / group. With DEFINE result / analysis we specify that this column contains the average per group.
After each DEFINE statement, you can specify options for formatting and labeling.
The Result
If you execute the code above, SAS generates a report and an output dataset.
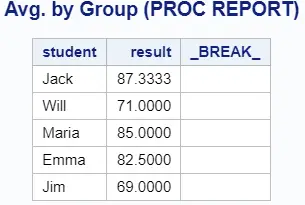
The report and output dataset that PROC REPORT generates are different. The formatting and labeling options only affect the report. With PROC REPORT you can neither format nor order the output dataset. Also, PROC REPORT creates an extra column break.
Advantages & Disadvantages of PROC REPORT
So, when should you use PROC REPORT to calculate the average per group?
Method 5: DATA STEP
The last method to calculate the average per group is with a SAS Data Step.
A Data Step is used to create datasets and manipulate columns. It can be used for many purposes. Here we show how to use it to calculate the average per group.
The Code
Let’s investigate the code.
proc sort data=work.exam_results
	out=work.exam_results_srt;
	by student;
run;

data work.avg_by_group_5 ;
	set work.exam_results_srt;
	by student;

	retain n_exams sum_results avg_result;
	if first.student then do;
		n_exams = 1;
		sum_results = result;
		avg_result = result;
	end;
	else do;
		n_exams = n_exams + 1;
		sum_results = sum_results + result;
		avg_result = sum_results / n_exams;
	end;

	if last.student then output;
	drop exam result;
	format avg_result comma12.2;
run;

title "Avg. by Group (DATA STEP)";
proc print data=work.avg_by_group_5 noobs;
run;
title;
Before you can use the Data Step to calculate the average per group, you need to order the data in ascending order by the student’s name. You can use PROC SORT for this purpose.
Since a SAS Data Step processes the input dataset row-by-row, it isn’t possible to calculate the average per group with a few lines of code. What the code above actually does, is calculating a rolling average for each student after a new exam. When SAS processes the first row of a group (i.e., a student), then the rolling average is reset. For this, we use the retain keyword and the if-else statement.
With the Data Step, it’s possible to format the data, but you can’t order the data.
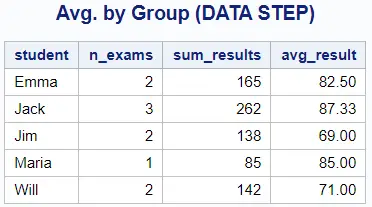
The Result
If you run the code above, the Data Step creates only a dataset. It doesn’t generate a report.
Advantages & Disadvantages
So, what are the advantages and disadvantages of a Data Step to calculate the average per group in SAS?
5 Ways to Calculate the Average per Group in SAS – Conclusion
So far we have discussed separately 5 methods to calculate the average per group in SAS. In this section, we summarize the advantages and disadvantages of each method. We use 5 aspects to compare each method:
- Complexity: Is the sas code easy or hard to understand for a beginner?
- Output: Does this method generate a report, a dataset, or both?
- Labeling: Can you specify the names of the columns of the report and/or dataset?
- Formatting: Can you format the columns of the report and/or dataset?
- Sorting: Can you order the data in the report and/or dataset?
| Method | Complexity | Output | Labeling | Formatting | Sorting |
|---|---|---|---|---|---|
| PROC SQL | Medium | Report or Dataset | Yes | Yes | Yes |
| PROC MEANS | Low | Report & Dataset | Yes | No | No |
| PROC TABULATE | High | Report & Dataset | Report Only | Report Only | No |
| PROC REPORT | Medium | Report & Dataset | Report Only | Report Only | No |
| DATA STEP | High | Dataset | Yes | Yes | No |
In conclusion, if you are looking for a method to generate a report with the average per group, then PROC TABULATE and PROC REPORT are the best options. Instead, if you want to create a dataset, then PROC SQL and the Data Step are preferred. You can use the PROC MEANS method if your main goal is to quickly analyze the data without further formatting.
![3 Easy Ways to Create an Index in SAS [Examples]](https://sasexamplecode.com/wp-content/uploads/2021/11/THUMBNAIL_CREATE_INDEX-400x260.jpg)
2 thoughts on “5 Ways in SAS to Calculate the Average per Group”
Comments are closed.