In this article, we discuss three ways how to find outliers in SAS.
In short, you can detect outliers in SAS by using the characteristics of the normal distribution, a boxplot, and winsorization.
Contents
Sample Dataset
For the examples in this article, we use a sample dataset of 1000 observations that we randomly draw from a Normal distribution.
We use the RAND function and a DO loop to create this sample dataset.
/* 0. Create Sample */
data work.my_data;
    call streaminit(123);

    do i = 1 to 1000;
	my_var = rand("Normal", 0, 1);
	output;
    end;

    drop i;
run;

proc print data=work.my_data (obs=10) noobs;
run;
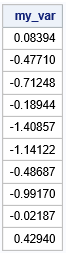
Below we show the first 10 observations.
How to Find Outliers in SAS?
The first method to finding outliers in SAS is based on the assumption that your data follow a normal distribution.
If the normality assumption holds, then all observations that are more than 3 standard deviations away from the mean are considered to be outliers. These observations can be above or below the mean.
Here is how to find outliers in SAS in 3 simple steps.
1. Test the Assumption of Normality
The first step if to test the normality assumption.
In SAS, you can use PROC UNIVARIATE to check if your data follow a normal distribution. You do this by adding the NORMAL option to the UNIVARIATE statement.
ods output TestsForNormality = work.normal_test;
ods output BasicMeasures = work.measures;

proc univariate data=work.my_data normal;
    var my_var;

    histogram my_var / normal;
run;

proc print data=work.normal_test noobs;
run;

proc print data=work.measures noobs;
run;
By running the code above, SAS carries out different tests for normality. For example, the Shapiro-Wilk test and the Kolmogorov-Smirnov test.
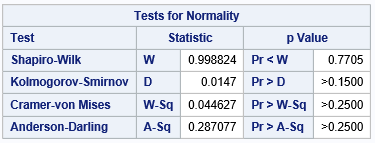
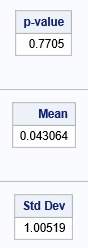
As the image above shows, the p-value of the Shapiro-Wilk test is 0.7705. Because the p-value is higher than 0.05 we don’t reject the null hypothesis and assume that the data follows a normal distribution.
Note that, PROC UNIVARIATE carries out the Shapiro-Wilk test for datasets up to 2000 observations. If your dataset has more observations, then you need to use one of the other tests for normality.
If your data is not normally distributed, then you can use the boxplot method to find outliers.
2. Save the Mean and Standard Deviation as Macro Variables
The second step to find outliers is to save the Mean and Standard Deviation as macro variables.
Besides generating reports, PROC UNIVARIATE can also create a dataset with summary statistics such as the p-value of the normality test, the mean, and the standard deviation. To do so, we use the ODS OUTPUT statement.
If you use the statement ODS OUTPUT TestForNormality, you can define the name of the dataset where SAS will save the results of the normality tests. Likewise, with the ODS OUTPUT BasicMeasures, you can create a dataset with the mean and standard deviation of your dataset.
You must place these statements before you run the PROC UNIVARIATE procedure.
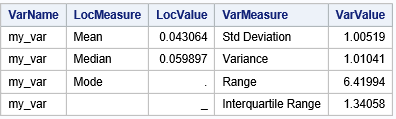
Below we show the two datasets that we created with the ODS statements.
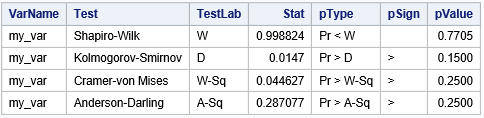
To make your code reusable and to find the outliers more efficiently, we save the p-value of the Shapiro-Wilk test, the mean, and the standard deviation as three macro variables with a SELECT INTO statement.
proc sql;
    select pValue label= 'p-value' into :pvalue from work.normal_test where test = 'Shapiro-Wilk';
    select LocValue label = 'Mean' into :mean from work.measures where LocMeasure ='Mean';
    select VarValue label = 'Std Dev' into :stddev from work.measures where VarMeasure ='Std Deviation';
quit;
3. Filter the Outliers
The third step to find outliers in SAS is filtering all observations that are 3 standard deviations above or below the mean.
In the sample dataset, the mean and standard deviation are 0.043064 and 1.00519, respectively. Hence, we consider observations above 3.058634 or below -2.972506 to be outliers.
We use a simple IF statement to filter observations from the dataset that match the criteria.
data work.outliers_normaldistr;
    set work.my_data;

    if my_var lt (&mean. - 3*&stddev.)
	or my_var gt (&mean. + 3*&stddev.) then output;
run;

proc print data=work.outliers_normaldistr noobs;
run;
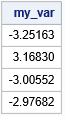
As you can see in the image below, we’ve found 4 outliers in the sample dataset.
How to Find Outliers in SAS with a Boxplot?
The second method to find outliers in SAS uses a boxplot.
A boxplot is a standardized way to summarize the distribution of a dataset. It does so by showing the minimum, the first quartile (Q1), the median, the third quartile (Q3), and the maximum.
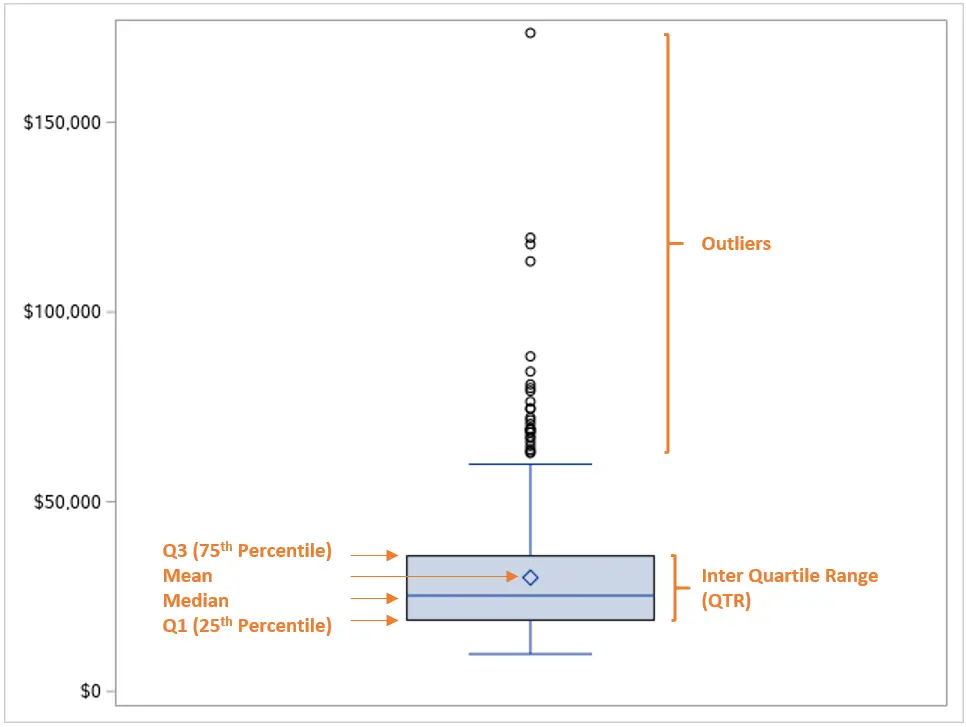
The distance between the first quartile (Q1) and third quartile (Q3) is called the Inter Quartile Range (IQR). All observations that lie 1.5 * IQR below the first quartile, or 1.5 * IQR above the third quartile, are considered outliers.
There are many methods to find quartiles in SAS and calculate the IQR. However, the easiest way to find the outliers is by creating a boxplot with the SGPLOT procedure.
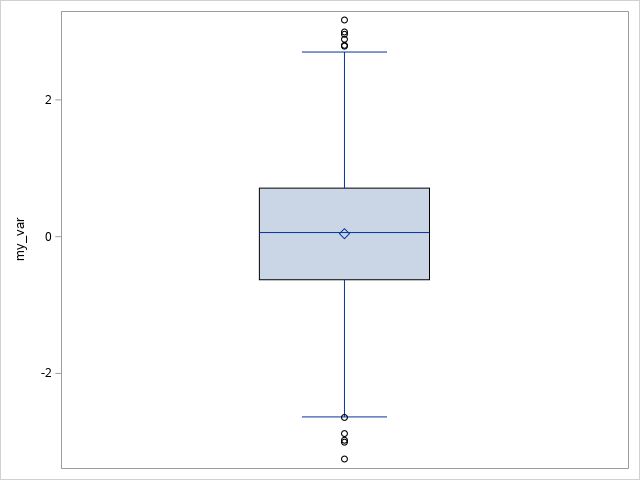
ods output sgplot=work.sgplotdata;
proc sgplot data=my_data;
    vbox my_var;
run;
By running the code above, SAS creates a boxplot and displays the outliers as circles.
You can obtain the values of the outliers by placing an ODS OUTPUT statement before creating the boxplot. If you use the sgplot option, SAS creates a table with boxplot statistics. For example, the first quartile, the media, the third quartile, and the outliers.
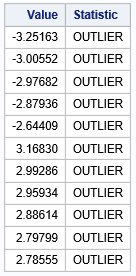
By using the RENAME and KEEP options, as well as the FIND function, you can easily obtain the values of the outliers.
data work.outliers_boxplot (keep = Value Statistic);
    set work.sgplotdata
	(rename=(BOX_MY_VAR____Y = Value
		BOX_MY_VAR___ST = Statistic));
    where find(Statistic, "OUTLIER") > 0;
run;

proc print data=work.outliers_boxplot noobs;
run;
Do you know? How to use boxplots to find the outliers per group
How to Find Outliers in SAS with Winsorization?
The third option to find outliers in SAS is with Winsorization.
Winsorization is a strategy to reduce the effect of outliers by removing all observations below the 5th percentile and above the 95th percentile. So, how do you apply winsorization to find outliers in SAS?
Finding outliers with winsorization in SAS is a 3 step process. Firstly, you calculate the 5th and 95th percentiles with the PROC MEANS procedure. Secondly, you save these percentiles as macro variables using the SELECT INTO statement. Finally, you filter the outliers with an IF statement.
proc means data=work.my_data p1 p99;
    var my_var;

    output out=work.percentiles_p1_p99
	p1 = P_1
	p99 = P_99;
run;

proc sql;
    select p_1 into :p1 from work.percentiles_p1_p99;
    select p_99 into :p99 from work.percentiles_p1_p99;
quit;

data work.outliers_winsorization;
    set work.my_data;

    if my_var lt &p1.
	or my_var gt &p99. then output;
run;


2 thoughts on “3 Easy Ways to Find Outliers in SAS”
Comments are closed.