Calculating percentiles (quartiles) is a common task when you analyze your data. However, how do you calculate percentiles in SAS? In this article, we discuss 3 methods to find them.
The easiest method to calculate percentiles in SAS is with the PROC UNIVARIATE procedure. By default, this procedure calculates and shows the most common percentiles and quartiles. Moreover, this procedure can also calculate less common percentiles as well as percentiles per group.
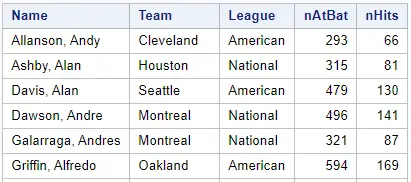
In this article, we use the BASEBALL dataset from the SASHELP library in our examples. This dataset contains salary and performance information for Major League Baseball players from 1986. We will use the column nHits (number of hits) to demonstrate how to calculate percentiles in SAS.
Contents
1. Calculate Percentiles with PROC UNIVARIATE
How to Calculate Common Percentiles?
The first, and easiest method to calculate percentiles in SAS is with PROC UNIVARIATE.
PROC UNIVARIATE is a powerful SAS Base procedure that you can use to assess the distribution of your data. Amongst other statistics, PROC UNIVARIATE calculates by default the most common percentiles and quartiles.
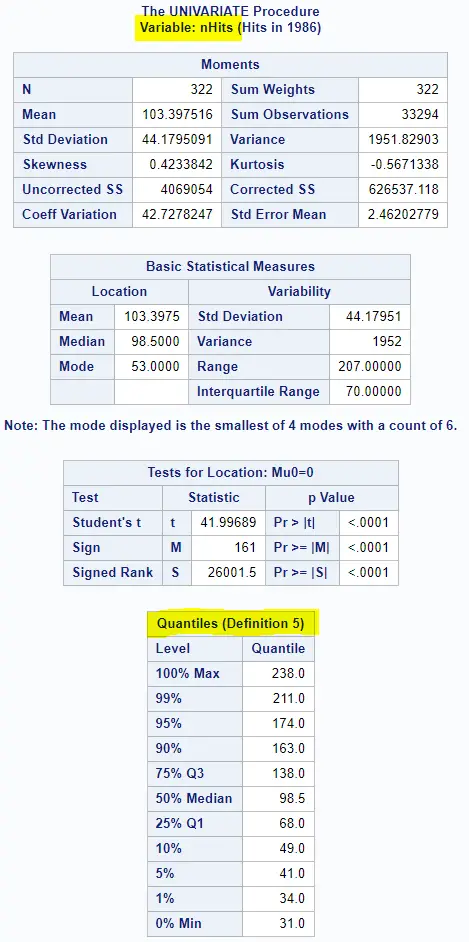
You run the UNIVARIATE procedure by defining the input dataset (DATA option) and the variable you want to assess (VAR option). With the code below we run the procedure to investigate the nHits column from the Baseball dataset.
proc univariate data=sashelp.baseball;
    var nHits;
run;
Below we show the standard output of PROC UNIVARIATE. At the end of the report, SAS shows the most common percentiles and quartiles.
How to Calculate Non-Standard Percentiles?
Besides the percentiles above, PROC UNIVARIATE can also calculate less common percentiles. For example, the 99.5th percentile.
To obtain a non-standard percentile in SAS, you need to create an output dataset and define the percentile you want to calculate. Compared to the default PROC UNIVARIATE code, you need to add:
- The OUTPUT statement and the OUT option. With this statement and option, you define the name of the output dataset that will contain the desired percentile.
- The PCTLPTS option. With this option, you specify the percentile you want to calculate. In this example, we calculate the 99.5th percentile.
- the PCTLPRE option. With this option, you define the prefix of the output column. Here we use “P_”. So, our output column will be called “P_99_5”.
proc univariate data=sashelp.baseball;
    var nHits;

    output out=work.baseball_percentile_99_5
        pctlpts = 99.5
	pctlpre = P_;
run;

proc print data=work.baseball_percentile_99_5 noobs;
run;
If you run the code above, you will get the following output.

How to Calculate Multiple Percentiles?
You can use PROC UNIVARIATE in SAS to create at once a dataset with multiple percentiles. You specify the percentiles (separated by commas) with the PCTLPTS option.
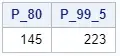
In the example below, we calculate the 80th and 99.5th percentile.
proc univariate data=sashelp.baseball;
    var nHits;

    output out=work.baseball_percentiles_80_99_5
	pctlpts = 80, 99.5
	pctlpre = P_;
run;

proc print data=work.baseball_percentiles_80_99_5 noobs;
run;
How to Calculate a Range of Percentiles?
Another useful feature of the PROC UNIVARIATE procedure is that you can calculate a complete range of percentiles. You can even define the step size of the range.
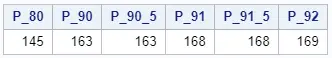
In the example below, we calculate the 80th percentile as well as all percentiles between 90th and 92nd with a step size of 0.5.
proc univariate data=sashelp.baseball;
    var nHits;

    output out=work.baseball_percentiles_80_90to92
	pctlpts = 80, 90 to 92 by 0.5
	pctlpre = P_;
run;

proc print data=work.baseball_percentiles_80_90to92 noobs;
run;
How to Calculate Percentiles by Group?
Calculating percentiles per group in SAS is a two-step process. First, you need to order your dataset by the variable that defines the groups. Then, you use PROC UNIVARIATE to calculate the percentiles.
In the example below, we will calculate the percentiles by the League variable. We use PROC SORT to order our dataset before we run PROC UNIVARIATE.
proc sort data=sashelp.baseball out=work.baseball; by League; run; proc univariate data=work.baseball; var nHits; by League; output out=work.baseball_percentiles_by_group pctlpts = 80, 90 to 92 by 0.5 pctlpre = P_; run; proc print data=work.baseball_percentiles_by_group noobs; run;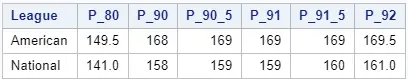
2. Calculate Percentiles with PROC MEANS
The second method to calculate percentiles in SAS is with PROC MEANS.
PROC MEANS is a SAS Base procedure that you can use for analyzing your data. It provides descriptive statistics such as the number of observations, the sum, the mean, and the median.
PROC MEANS can also help you to find percentiles. With PROC MEANS, you can calculate the following percentiles: 1, 5, 10, 25, 50, 75, 90, 95, and 99. Although the number of percentiles that PROC MEANS provides is less compared to PROC UNIVARIATE, we recommend using PROC MEANS (if possible) since it is faster than PROC UNIVARIATE.
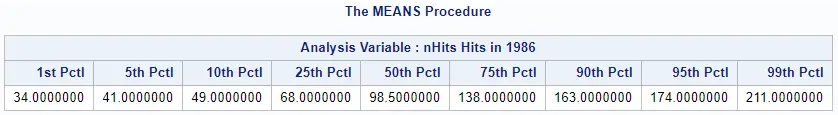
You use the following code to calculate percentiles with PROC MEANS.
proc means data=sashelp.baseball p1 p5 p10 p25 p50 p75 p90 p95 p99;
    var nHits;
run;
If you want to omit some percentiles, you need to leave them out of the PROC MEANS statement.
By default, PROC MEANS doesn’t create an output dataset. If you want to create a table with the calculated percentiles, you need to add an output statement and define the name of the dataset. It is also necessary to specify which percentiles you want to add to the output dataset, as well as their names.
proc means data=sashelp.baseball p1 p5 p10 p25 p50 p75 p90 p95 p99;
    var nHits;

    output out=work.percentiles_proc_means
	p1 = P_1
	p5 = P_5
	p10 = P_10
	p25 = P_25
	p50 = P_50
	p75 = P_75
	p90 = P_90
	p95 = P_95
	p99 = P_99;
run;

proc print data=work.percentiles_proc_means noobs;
run;

As you can see, PROC MEANS creates 2 extra columns in the output dataset (_TYPE_ and _FREQ_). You can remove them with the DROP option.
Do you know? How to Remove Columns with the DROP Option
How to Calculate the Percentiles per Group
Like PROC UNIVARIATE, you can also use PROC MEANS to calculate percentiles per group. Again, this is a two-step process. First, you need to sort your input dataset. Then, with PROC MEANS, you calculate the percentiles for each group.
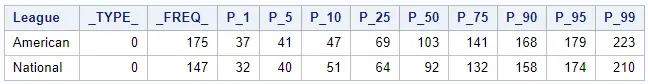
With the code below we calculate the percentiles for the League column and create an output dataset.
proc sort data=sashelp.baseball
    out=work.baseball;
    by League;
run;

proc means data=work.baseball p1 p5 p10 p25 p50 p75 p90 p95 p99;
    var nHits;
    by league;

    output out=work.percentiles_proc_means
	p1 = P_1
	p5 = P_5
	p10 = P_10
	p25 = P_25
	p50 = P_50
	p75 = P_75
	p90 = P_90
	p95 = P_95
	p99 = P_99;
run;

proc print data=work.percentiles_proc_means noobs;
run;
3. Calculate Percentiles with PROC FREQ
The third method to calculate percentiles in SAS is with PROC FREQ. This method is especially useful if you want to calculate a percentile and save it as a macro variable.
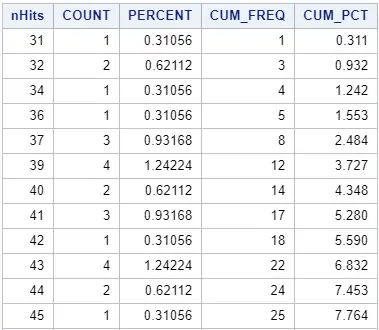
The first step is to create a frequency table with PROC FREQ. A frequency table in SAS counts the number of times an event occurs (e.g., number of hits). As an extra statistic, SAS can calculate the cumulative percentage.
Here we create a frequency table for the nHits column in the Baseball dataset.
proc freq data=sashelp.baseball;
    table nHits
    / out = work.frequency_table outcum;
run;
Do you know? How to Sort a Frequency Table in Descending Order
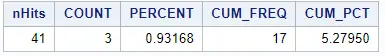
The next step is to find the first row where the value in the column CUM_PCT is greater than or equal to the desired percentile. For example, we use the following PROC SQL code to calculate the 5th percentile.
proc sql;
    create table work.P5 as
	select *
	from work.frequency_table
	where cum_pct ge 5
	having nHits = min(nHits);
quit;

proc print data=work.p5 noobs;
run;
How to Save a Percentile as a Macro Variable?
Sometimes is it’s necessary to save a percentile as a macro variable.
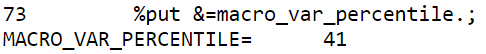
Here we use PROC FREQ, PROC SQL, and the SELECT INTO clause to save a percentile as a macro variable. First, we create a frequency table with PROC FREQ. Then, we select the desired percentile with PROC SQL. Finally, we use the SELECT INTO clause to save the percentile as a SAS macro variable.
proc freq data=sashelp.baseball;
    table nHits
    / out = work.frequency_table outcum;
run;

proc sql;
    select nHits into :macro_var_percentile
    from work.frequency_table
    where cum_pct ge 5
    having nHits = min(nHits);
quit;
Do you know? How to Use SELECT INTO to Create a Macro Variable
Summary
In this article, we discussed 3 methods to calculate percentiles (quantiles) in SAS. Each method has its advantages and disadvantages. Here we provide a summary of the methods.
3 Methods to Calculate Percentiles (Quantiles) in SAS
| Method | Advantages | Disadvantages |
|---|---|---|
| 1. PROC UNIVARIATE | Easy to code All percentiles possible | Can be slow for big datasets |
| 2. PROC MEANS | Easy to code Fast | Only 9 standard percentiles |
| 3. PROC FREQ + PROC SQL | Intuitive method Save percentile as a macro variable | More code necessary |


3 thoughts on “3 Easy Ways to Calculate Percentiles in SAS (Examples)”
Comments are closed.