Besides the sum, the minimum, the maximum, and the average, the standard deviation is a useful statistic to quickly assess your data. Therefore, in this article, we show how to calculate the standard deviation in SAS.
In SAS, there are 3 easy ways to calculate the standard deviation, namely with the std() function of the PROC SQL procedure, with the PROC MEANS procedure, or with the PROC UNIVARIATE procedure. All procedures can calculate the standard deviation for one or more columns, as well as by group. These methods can also create a SAS output dataset with the standard deviation.
In this article, we discuss how to calculate the standard deviation:
- Of one column in a SAS dataset or table.
- Of multiple columns
- Grouped by one column
- Grouped by multiple columns
We use the CARS dataset from the SASHELP library to support the explanations with examples.
Contents
3 Ways to Calculate the Standard Deviation in SAS
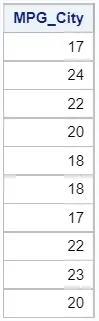
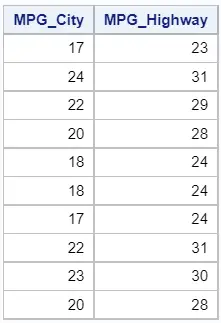
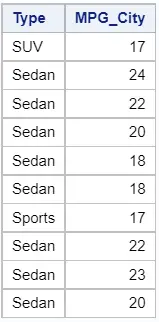
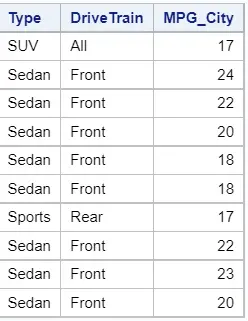
First, we demonstrate how to calculate the standard deviation of one column. For example, the MPG_City column from the CARS dataset.
Below, we show the first 10 observations.
Calculate the Standard Deviation with PROC SQL
To calculate the standard deviation in SAS within PROC SQL code, you use the STD()-function. This function has one argument, namely a numeric constant, variable, or expression, and returns the standard deviation of the non-missing values.
Although unlikely to happen, the STD()-function returns a missing value if all values of the argument are missing.
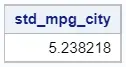
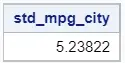
In the example below, we show how to create a new column with the standard deviation.
proc sql;
    select std(mpg_city) as std_mpg_city
    from sashelp.cars;
quit;
With the code above, SAS generates only a report. If you want both a report and an output dataset with the standard deviation, then you need to add the CREATE TABLE statement.
Calculate the Standard Deviation with PROC MEANS
In SAS, you can also calculate the standard deviation with the PROC MEANS procedure. These are the steps:
- Start the PROC MEANS procedure
You start the procedure with the PROC MEANS statement
- Define the input dataset
You define the input dataset with the data=-option. First, you write the data keyword followed by an equal sign and the name of your dataset
- Define the statistics you want to calculate
By default, the PROC MEANS procedure calculates the number of observations, the mean, the minimum, the maximum, and the standard deviation. If you only want to calculate the standard deviation, you need to add the std options to the PROC MEANS statement.
- Specify the column/variable of which you want to know the standard deviation
You use the VAR statement to specify the column (or variable) of which you want to calculate the standard deviation.
- Finish the PROC MEANS procedure
To finish and execute the PROC MEANS procedure, you use the RUN statement.
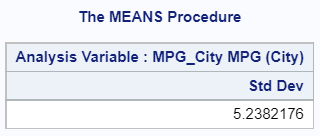
In the example below, we use the PROC MEANS procedure to calculate the standard deviation of the MPG_City column.
proc means data=sashelp.cars std;
    var mpg_city;
run;
Calculate the Standard Deviation with PROC UNIVARIATE
Similar to the PROC MEANS procedure, you can also use the PROC UNIVARIATE procedure to calculate the standard deviation in SAS.
The syntax of the PROC UNIVARIATE procedure is almost identical to the PROC MEANS procedure. However, there are two differences:
- The procedure starts with the PROC UNIVARIATE statement (obviously).
- You can’t use the std option to only calculate the standard deviation. By default, PROC UNIVARIATE returns many statistics to assess the distribution of your data. There are no options to limit the output report to only the standard deviation.
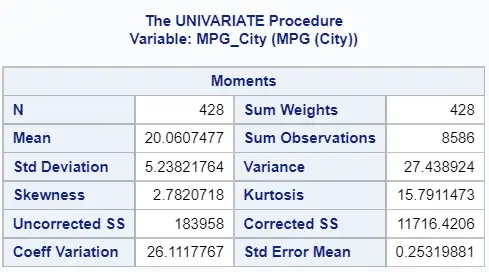
To reduce the output slightly, you can add the ODS SELECT MOMENTS statement. By adding this statement, SAS generates a report with only the moments of the variable.
Below, we demonstrate how to use the PROC UNIVARIATE to calculate the standard deviation.
ods select moments;
proc univariate data=sashelp.cars;
    var mpg_city;
run;
How to Calculate the Standard Deviation of Multiple Variables
So far, we’ve demonstrated how you can calculate the standard deviation of one column. If you want to know the standard deviation of multiple columns, then repeating the code above isn’t very efficient. Fortunately, SAS provides three options to calculate the standard deviation of multiple columns at once.
We will use the table below to demonstrate how to efficiently calculate the standard deviation of multiple columns.
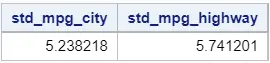
With PROC SQL you only need to add another row with the STD()-function.
proc sql;
    select std(mpg_city) as std_mpg_city,
	std(mpg_highway) as std_mpg_highway
    from sashelp.cars;
quit;
Calculating the standard deviation with PROC MEANS and PROC UNIVARIATE is even easier. You only need to amend the VAR statement.
With the VAR statement, you can specify of which column(s) you want to calculate the standard deviation. If you have more than one column, you need to separate them with a blank.
proc means data=sashelp.cars std;
    var mpg_city mpg_highway;
run;
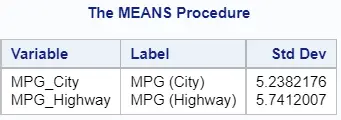
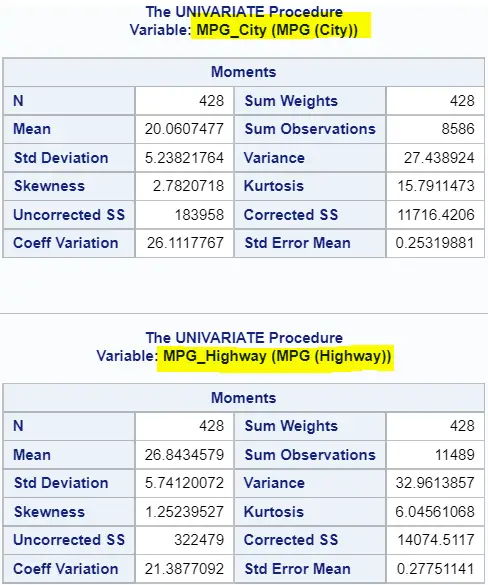
As the image above shows, the PROC MEANS procedure creates one table with the standard deviation of each variable on a new row. In contrast, the PROC UNIVARIATE procedure creates a separate table of moments per variable (see below). This makes the PROC UNIVARIATE procedure less user-friendly if you want to compare quickly the standard deviation of multiple variables.
ods select moments;
proc univariate data=sashelp.cars;
    var mpg_city mpg_highway;
run;
How to Calculate the Standard Deviation by Group in SAS
In the sections above, we showed how to obtain the standard deviation of one or more columns. Another frequently asked question is how to calculate the standard deviation per group in SAS. That is to say, we calculate the standard deviation of a column according groups based on the values of another column.
For example, in this section, we’ll demonstrate how to calculate the standard deviation of the MPG_City column for each Type of vehicle.
With PROC SQL
To calculate the standard deviation per group in SAS with SQL code, you need the STD()-function and the GROUP BY statement. The STD()-function calculates the standard deviation of the column of interest. With the GROUP BY statement you specify the column that defines the groups.
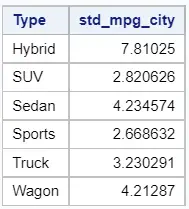
The SAS code below shows an example of how to calculate the standard deviation per group.
proc sql;
    select type,
	std(mpg_city) as std_mpg_city
    from sashelp.cars
    group by type;
quit;
With PROC MEANS
You can also use the PROC MEANS procedure to calculate the standard deviation per group. These are the steps:
- Start the procedure with the PROC MEANS statement.
- Specify the name of the input dataset with the data=-option.
- Optionally, add the STD keyword to only calculate the standard deviation. If you omit the STD keyword, SAS will also calculate the mean, minimum, and maximum.
- Use the VAR statement to specify the variable of which you want to calculate the standard deviation.
- Add the CLASS statement to speficy the variable that defines the groups.
- Execute the PROC MEANS procedure with the RUN statement.
The SAS code below contains an example of these steps.
proc means data=sashelp.cars std;
    var mpg_city;
    class type;
run;
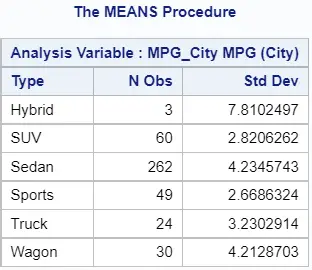
As the image above shows, the PROC MEANS procedure creates one table with the number of observations and the standard deviation per group.
With PROC UNIVARIATE
Likewise, you can calculate the standard deviation per group with the PROC UNIVARIATE statement. The syntax is almost identical, except for the STD keyword. PROC UNIVARIATE calculates and shows, by default, many other statistics. You can suppress some of theses statistics with the ODS SELECT MOMENTS statement.
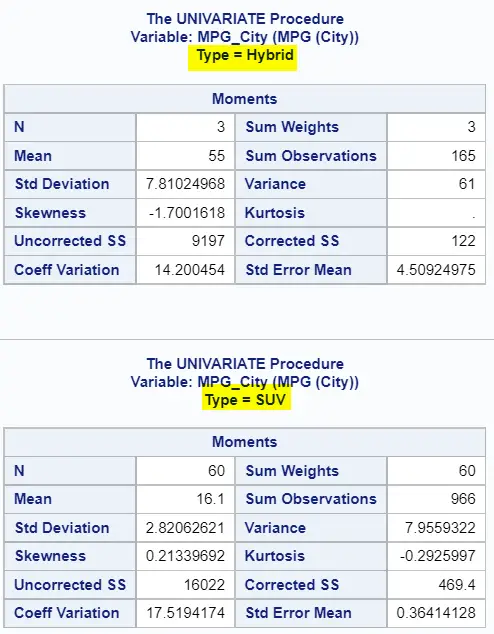
ods select moments;
proc univariate data=sashelp.cars;
    var mpg_city;
    class type;
run;
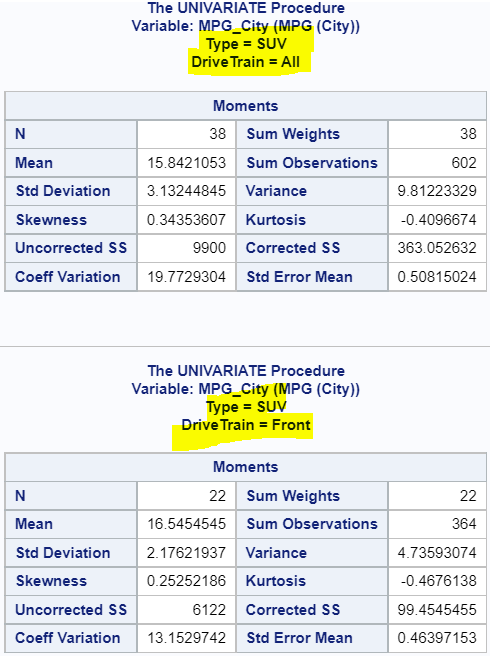
As the image below shows, the PROC UNIVARIATE procedure creates a separate table per group with the standard deviation (and other statistics). As a consequence, if you want to easily compare the standard deviation of different groups, then the PROC MEANS procedure is better.
How to Calculate the Standard Deviation by Multiple Groups
Above we’ve shown how to calculate the standard deviation of a variable based on groups that were defined by one variable. However, you can also calculate the standard deviation of a variable grouped by multiple variables.
For example, in this section we show 3 examples how to calculate the standard deviation of the MPG_City variable grouped by the Type and DriveTrain variables.
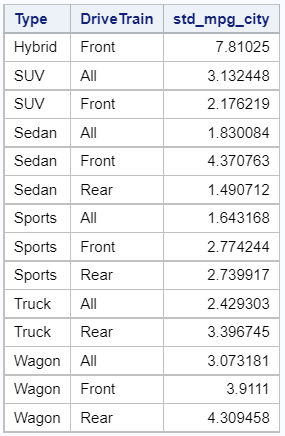
With PROC SQL, you can calculate the standard deviation of a variable based on multiple groups with the GROUP BY statement. The GROUP BY keyword is followed by the variables that define the groups, separated by a comma.
proc sql;
    select type,
	drivetrain,
	std(mpg_city) as std_mpg_city
    from sashelp.cars
    group by type,
	drivetrain;
quit;
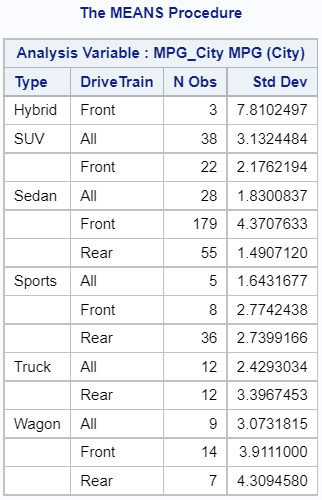
You can also calculate the standard deviation by multiple groups with the PROC MEANS statement. You specify the columns that define the groups with the CLASS statement. The statement starts with the CLASS keyword followed by the variables, separated by a whitespace.
proc means data=sashelp.cars std;
    var mpg_city;
    class type drivetrain;
run;
Similarly, you can use the CLASS statement in the PROC UNIVARIATE procedure to calculate the standard deviation by multiple groups. However, in contrast to PROC MEANS, PROC UNIVARIATE returns a separate table per group.
ods select moments;
proc univariate data=sashelp.cars;
    var mpg_city;
    class type drivetrain;
run;
How to Create an Output Table with the Standard Deviation in SAS
Lastly, we explain how to create an output table with the standard deviation.
You create a SAS output dataset in PROC SQL with the CREATE TABLE statement. Ater the CREATE TABLE statement you write the usual code to calculate the standard deviation. For example.
proc sql;
    create table work.std_mpg_city as
	select std(mpg_city) as std_mpg_city
	from sashelp.cars;
quit;
In case of PROC MEANS and PROC UNIVARIATE, you create a output table with the standard deviation by adding the OUTPUT statement to the SAS code. The OUTPUT statement starts with the OUTPUT keyword followed by the out=-option. With the out=-option how define the name of the output table. With the optional std=-option you can define the name of the column that contains the standard deviation.
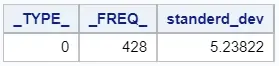
proc means data=sashelp.cars std;
    var mpg_city;
    output out=work.std_mpg_city std=standerd_dev;
run;
ods select moments;
proc univariate data=sashelp.cars;
    var mpg_city;
    output out=work.std_mpg_city std=standerd_dev;
run;
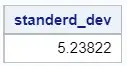
As the images above show, the output tables of the PROC MEANS and PROC UNIVARIATE procedures are slightly different. Besides the standard deviation, the PROC MEANS procedure also adds the _TYPE_ and _FREQ_ columns. You can remove these columns the addition drop=-option.
![5 Best Ways to Concatenate Strings in SAS [Examples]](https://sasexamplecode.com/wp-content/uploads/2020/12/THUMBNAIL_CONCATENATE-400x260.jpg)
3 thoughts on “3 Easy Ways to Calculate the Standard Deviation in SAS [Examples]”
Comments are closed.