When you work with data, there will be opportunities that you need to know the frequency of a given item. In this article, we discuss how to create frequency tables in SAS.
In short, you use the PROC FREQ procedure to create a frequency table in SAS. For a simple frequency table, you only need to specify the input dataset with the DATA=-option. Optionally, you can add a TABLES statement and a variable name to create a frequency table of a specific variable.
Besides basic frequency tables, we also cover the most frequently used options of PROC FREQ. For example, options to order a frequency table descendingly, and how to create an output data set with frequencies.
Contents
Sample Data
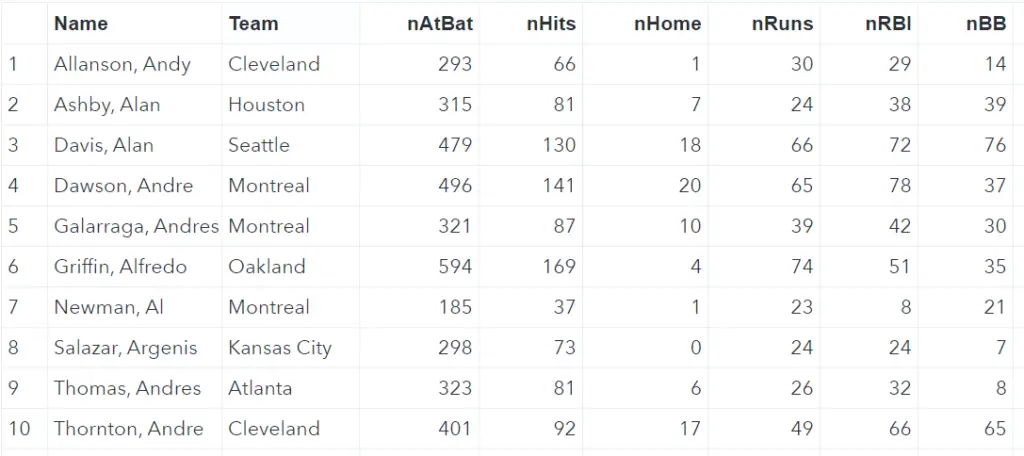
Throughout this article, we will use the Baseball data set from the SASHELP library. This data set contains information about the performance and salary of Major League Baseball players from the 1986 season. For our examples, we will mainly use the Team and Salary columns.
proc print data=sashelp.baseball;
run;
How to Create Frequency Tables with PROC FREQ in SAS
As mentioned in the introduction, you can create frequency tables in SAS with the PROC FREQ procedure.
The syntax of the PROC FREQ procedure is relatively straightforward. The only obligatory argument is the SAS data set you want to use to create frequency tables. You use the DATA=-option to specify this dataset.
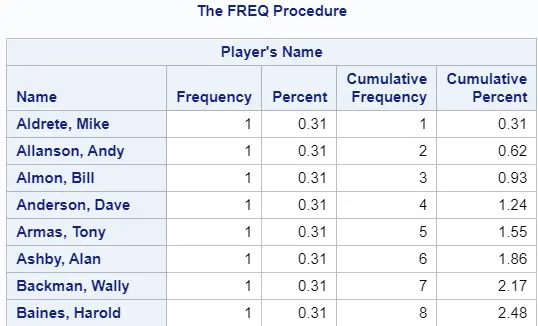
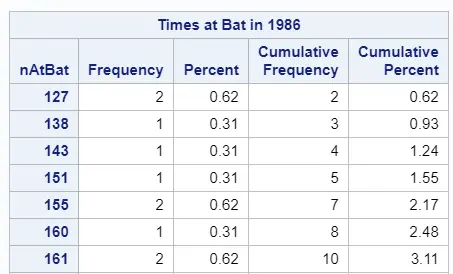
By default, SAS creates a frequency table for each variable of the data set. The code and images below show the results of this default behavior.
proc freq data=sashelp.baseball;
run;
By default, the PROC FREQ procedure creates frequency tables with 5 columns, namely:
- A value of which SAS counts the frequency.
- The frequency of each value in the dataset.
- The percentage of each value in the dataset.
- The cumulative frequency.
- The cumulative percentage.

Later on in this article, we show how to suppress the cumulative frequency and cumulative percentage.
How to Create a Frequency Table for a Specific Variable
By default, the PROC FREQ procedure generates a frequency table for all variables. However, you might only be interested in the frequency of the values in one specific variable.
For example, the Baseball data set contains 24 columns and we are only interested in the frequencies of the values in the columns Team and Salary.
With the TABLES statement, you can specify the column(s) for which SAS will create a frequency table.
For example, the SAS code below shows how to create two frequency tables. One for the Team column, and one for the Salary column.
proc freq data=sashelp.baseball;
	tables Team Salary;
run;
How to Order Frequency Tables in SAS
By default, SAS sorts the frequency tables in an alphabetical (character columns) or ascending order (numerical columns). However, it might be useful to order the frequency table by the frequencies.
You can use the ORDER=-option to sort the output of the PROC FREQ procedure.
For instance, with the code below, we order the frequency table in a descending order based on the frequency of each team in the Baseball data set.
proc freq data=sashelp.baseball order=freq;
	tables Team;
run;

Note that, the ORDER=-option applies to all frequency tables. In other words, if you create two frequency tables, then SAS orders both tables.
How to Handle Missing Values in Frequency Tables
If you work with data, missing values are common. Depending on your needs, you can treat missing values differently with PROC FREQ.
By default, SAS ignores the missing values. That is to say, SAS doesn’t show the missing values in the output table as a separate value. Moreover, the missing values are also ignored to calculate the (cumulative) frequency and (cumulative) percentage.
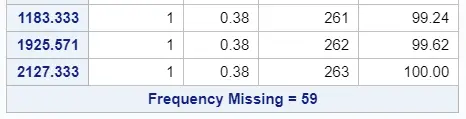
Only at the bottom of the frequency tables, SAS informs the number of missing values.
For example, the SAS code below creates a frequency table of a variable with missing values (the salary column).
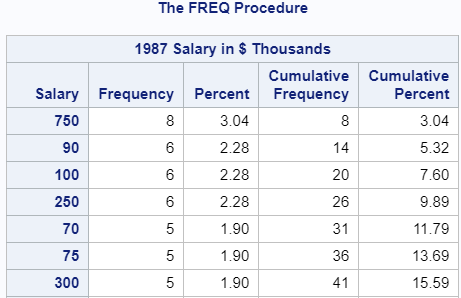
proc freq data=sashelp.baseball order=freq;
	tables salary;
run;
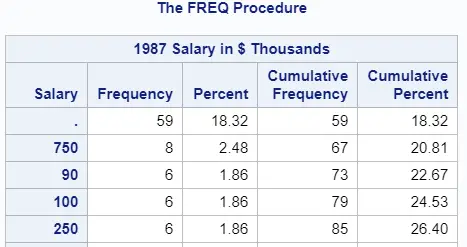
However, if necessary, you can use the MISSING=-option to include the missing values as a separate category in the frequency table.
The MISSING=-option will also cause SAS to consider them while calculating the (cumulative) percentage column.
The SAS code below demonstrates how to use this option.
proc freq data=sashelp.baseball order=freq;
	tables salary / missing;
run;
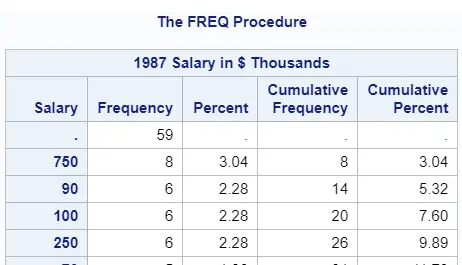
Finally, you can use the MISSPRINT=-option to only show the missing values in the frequency table. However, this option won’t include the missing values in the calculation of the percentage, cumulative frequency, and cumulative percentage columns.
proc freq data=sashelp.baseball order=freq;
	tables salary / missprint;
run;
How to Create an Output Table with Frequencies
One of the most frequently asked questions regarding PROC FREQ is how to create an output table with PROC FREQ.
You create an output table with frequencies with the OUT=-option. This option is part of the TABLES statement and must be placed after a forward slash.
For example, with the code below, we create an output table with frequencies for the Team variable and the Division variable.
proc freq data=sashelp.baseball;
	tables Team /out=work.team_freq;
	tables Division /out=work.division_freq;
run;
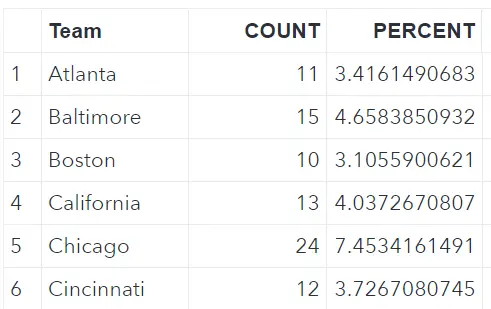
By default, the output data set contains three columns:
- The variable.
- The count (i.e., frequency).
- The percentage.
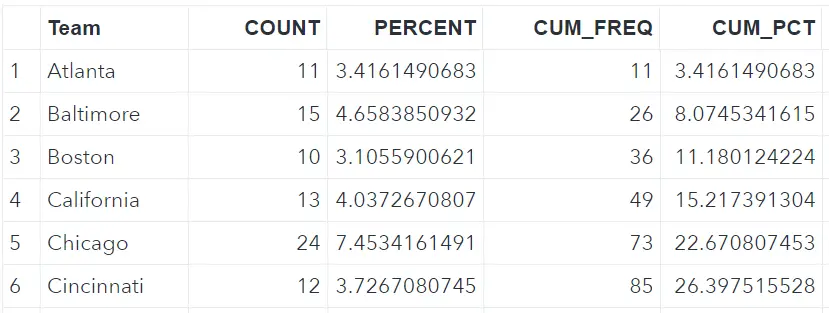
To add the cumulative frequency and the cumulative percentage to the output column, you can add the OUTCUM=-option to the PROC FREQ procedure. This option is part of the TABLES statement and is added after a forward slash.
For example, the SAS code below adds the CUM_FREQ and CUM_PCT columns to the output dataset.
proc freq data=sashelp.baseball;
	tables Team /out=work.team_freq outcum;
run;
How to Create Frequencies Based on Formats
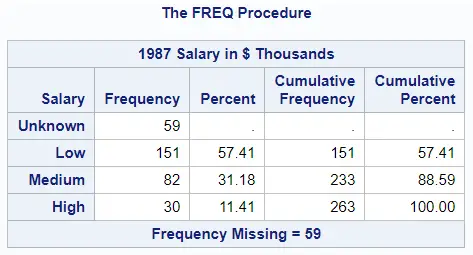
Lastly, you can create frequency tables in SAS based on a format.
In the example below, we create a user-defined format with 4 salary categories: Low, Medium, High, and Unknown. Based on these new categories we create the frequency tables.
You use the FORMAT statement to apply a format before creating the frequency tables with PROC FREQ.
So, in this example, we create and apply the format salary_group to the variable salary. To include the Unknown group in the output we added the MISSPRINT=-option.
proc format;
	Value salary_group
	. = "Unknown"
	1 - 500 = "Low"
	501 - 1000 = "Medium"
	1001 - high = "High"
	;
run;

proc freq data=sashelp.baseball order=freq;
	tables salary / missprint;
	format salary salary_group.;
run;
Do you know: How to Create User-Defined Formats in SAS
How to Select the Top N Frequencies
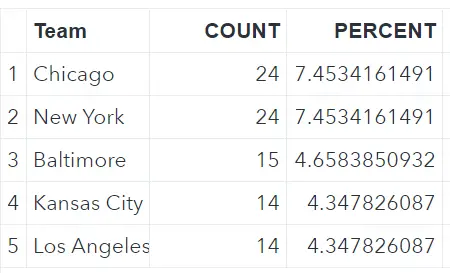
Lastly, we demonstrate how to create a frequency table with the top N frequencies.
The first step is to create a frequency table, sort it in descending order, and create an output dataset. For this, we use the TABLES statement, the ORDER=-option, and the OUT=-option.
The second step is to create a SAS DATA Step as select the top N rows (i.e., frequencies). You can select the first N rows with, for example, the OBS=-option.
In the example below, we create a SAS dataset with the top five frequencies of the Team column.
proc freq data=sashelp.baseball order=freq;
	tables Team /out=work.team_freq;
run;

data work.team_freq_top_5;
	set work.team_freq (obs=5);
run;
Relate Article: How to Select the Top N Rows of a Data Set
![5 Best Ways to Concatenate Strings in SAS [Examples]](https://sasexamplecode.com/wp-content/uploads/2020/12/THUMBNAIL_CONCATENATE-400x260.jpg)

6 thoughts on “How to Create Frequency Tables in SAS”
Comments are closed.